Contact Information

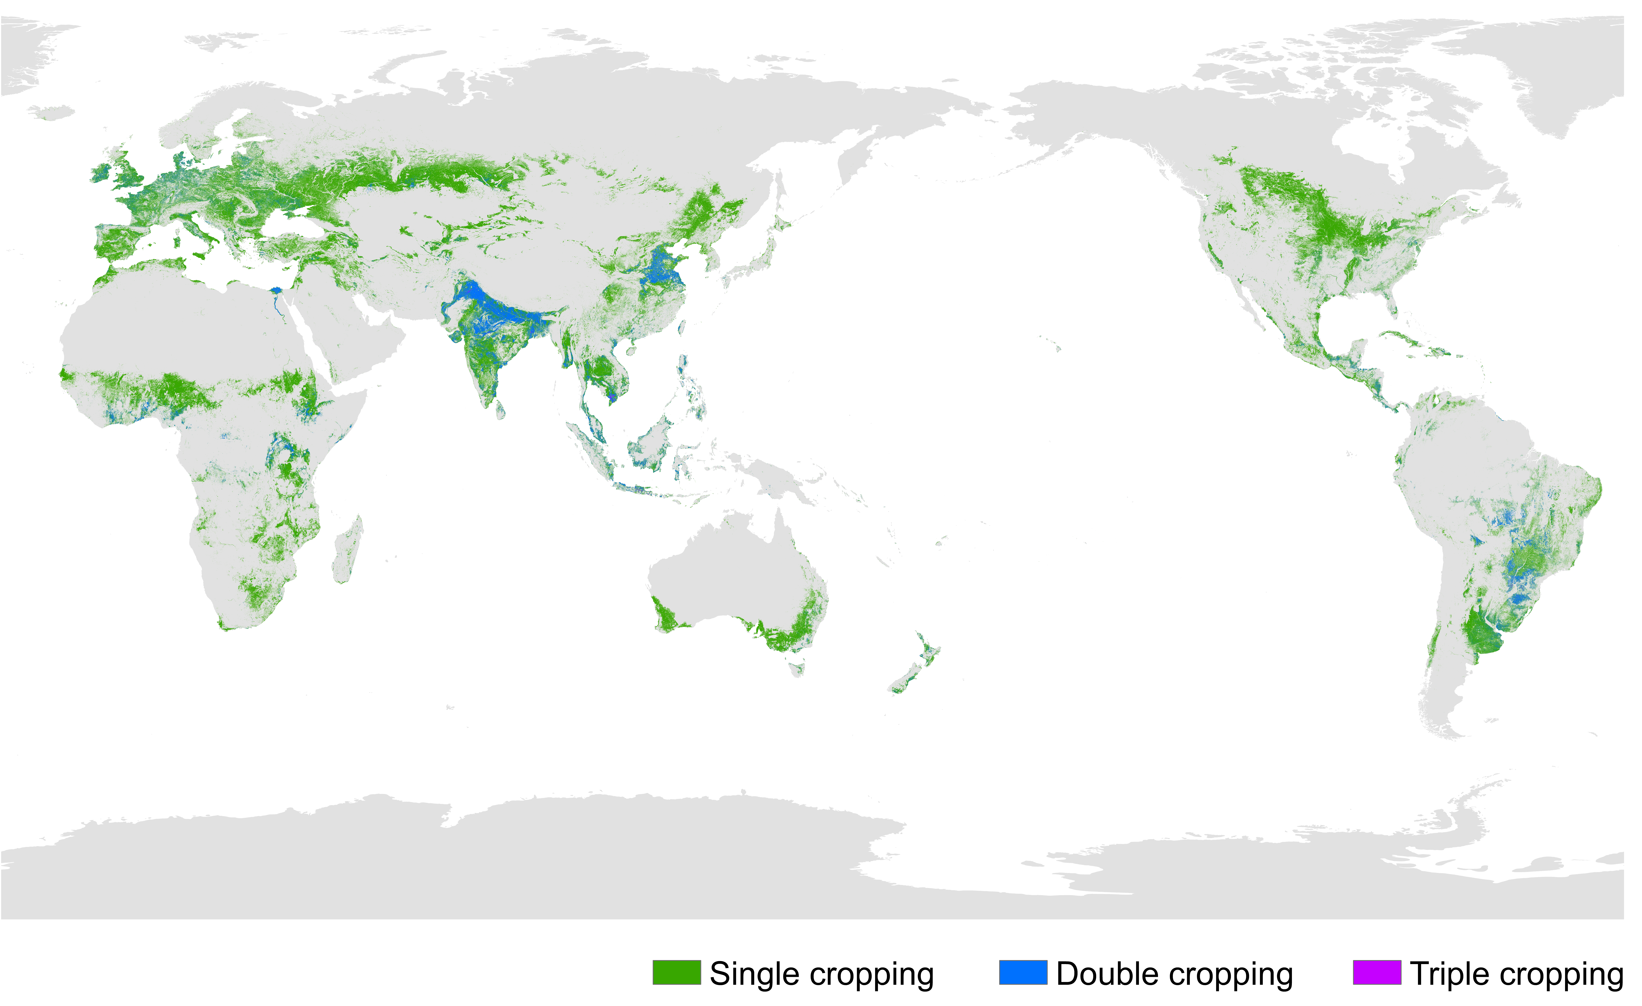
Global 30-m cropping intensity in 2020 (GCI30_2020)
Dataset Overview
This product was generated using all available Landsat series and Sentinel-2 satellite imageries during 2019-2021. Due to the difference in crop calendar in the northern and southern hemispheres, there are minor variations in the acquisition dates of remote sensing data used in different agro-ecological zones. Most regions used data from February 2, 2019 to February 1, 2022 while products in many regions in the southern hemisphere were generated using remote sensing data from November 1, 2018 to October 31, 2021. Cropping intensity in a few regions was extracted based on satellite imageries from late August 2018 to mid-August 2021 due to the unique crop phenology. The geographical scope of this product includes 180º W to 180º E and 60º S to 80º N. High latitude areas in the northern and southern hemispheres and areas with no cropland are not included in the monitoring scope. The whole processing chain was automatically done by online code. All products were quality controlled by the experts to make sure all the tiles were correctly generated. Accuracy was first assessed over eight regions covering an area of 10º×10º across the globe with different agricultural practices. The overall accuracy is 90.4%. The assessment was further expanded to global scale using 3662 samples, showing an overall accuracy of 92.9% for the whole globe.

Dataset Details
Spatial Resolution: 30m
Time Resolution: years
Product Number: XDA19030201_005
Create Institution: International Research Center of Big Data for Sustainable Development Goals
Created By: Zhang Miao
Creation Date: 2022-08-18T16:00:00.000Z
File Size: 294
Data Format: GeoTiff
Type Of Data: Raster
Data Label:
Naming Convention
The "Global 30-m cropping intensity in 2020" was tiled into separate files in GEOTIFF format via GCS_WGS_1984 projection. Globally, 293 tiles were kept where at least one cropland pixel exists. Each file covers an area of 10º ×10º named in the following format 'Cropping_Intensity_30m_2019_2021_$regions$.tif'. The "region" in the file name is defined as N/S (North Hemisphere or South Hemisphere) followed by two digits of latitude in the top-left corner of the file and E/W (Eastern Hemisphere or Western Hemisphere) followed by three digits of longitude in the top-left corner. Each file contains two layers in the data product. Values in layer 1 are integers indicating the planting frequency of cropland in 2019-2021. The valid value should be within 100 and the value 100 denotes the background pixel. Values in layer 2 are integers indicating the planting frequency of cropland in 2020. Values 1, 2, and 3 stand for cropping patterns for single-season, double-season, and multi-season respectively. Value 100 in layer 2 denotes the background pixel.
Data Citation
Miao Zhang, Bingfang Wu. Global 30-m cropping intensity in 2020 (GCI30_2020), Beijing: International Research Center of Big Data for Sustainable Development Goals (CBAS), 2022. doi: 10.12237/casearth.62ff4caa819aec75a535cbe7
Data Licence Agreement
Users of this product shall clearly indicate the source as "Global 30-m cropping intensity in 2020 (GCI30_2020)" in the research output, including published or unpublished papers, thesis, reports, data products and other results. Data producers are not responsible for any losses as a result of the use of this data. The boundaries and markings used for the maps do not imply a formal endorsement or opinion by the data producer.
