Contact Information

1-m datasets of mangrove forest changes in Hainan Island from 2015 to 2019
Dataset Overview
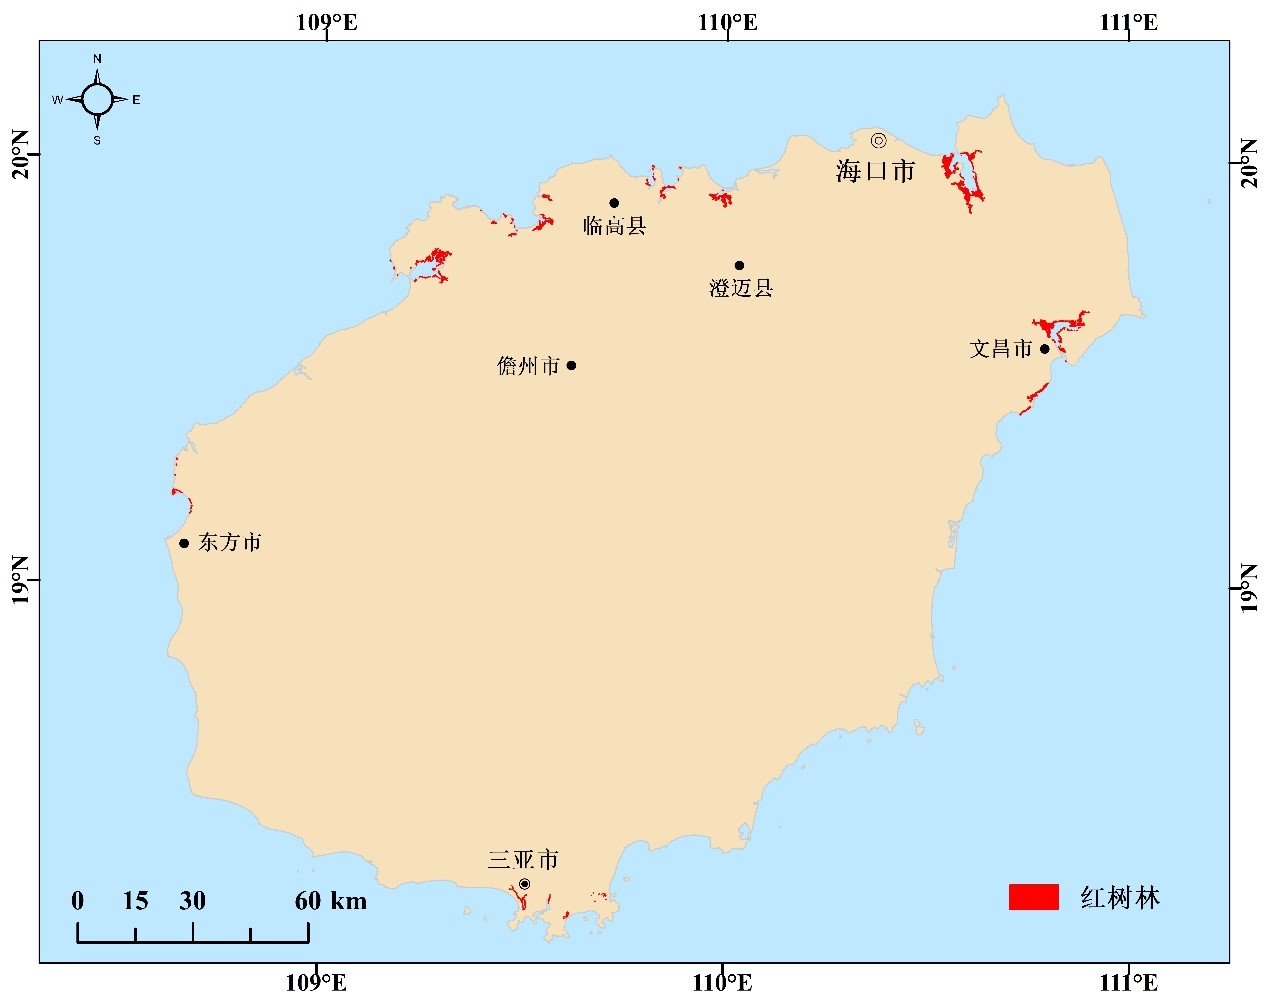
Mangrove forests are wetland ecosystems in the coastal zone with important ecological and eco-economic service values. At the same time, mangrove forests are vulnerable ecosystems, being under threat from both natural and anthropogenic forces, so mangrove monitoring is a permanent task. The development of remote sensing technology has provided an efficient and convenient means for mangrove monitoring. In this study, a support vector machine (SVM) classification method with Gaussian radial kernel function, penalty factor of 100 and Gamma function 0f 0.022 was used to obtain a dataset of mangrove forest changes on Hainan Island from 2015 to 2019 using Gaofen-2 (GF-2) data in 2015, 2017 and 2019, and combined with field survey data. The overall classification accuracy of this dataset is more than 99%, and the data volume is 58.7 MB. It can be used as the basic data for the analysis of spatial and temporal changes of mangrove forests, and can also provide decision support for the restoration, protection and management of mangrove wetland ecosystems, and provide basic data for the ecological environment supervision in Hainan Province.

Dataset Details
Spatial Resolution: 1m
Time Resolution: 2 years
Product Number: XDA19030105_008
Create Institution: International Research Center of Big Data for Sustainable Development Goals
Created By: Liao Jingjuan
Creation Date: 2022-12-13T08:50:13.241Z
File Size: 3
Data Format: shp
Type Of Data: Vector
Data Label:
Data Citation
Liao Jingjuan. 1-m datasets of mangrove forest changes in Hainan Island from 2015 to 2019. 2022.
Data Licence Agreement
Users of this product shall clearly indicate the source as " 1-m datasets of mangrove forest changes in Hainan Island from 2015 to 2019" in all forms of research output, including, but not limited to, published and unpublished papers, theses, manuscripts, books, reports, data products, and other academic output. The data producers are not responsible for any losses caused by the use of the data. The boundaries and marks used in the maps do not represent any official endorsement by or opinion of the data producers.
Funded Projects
Supported by Hainan Provincial Department of Science and Technology under Grant No. ZDKJ2019006 and the "Strategic Priority Research Program" of the Chinese Academy of Science, Grant No. XDA19030105
