Contact Information

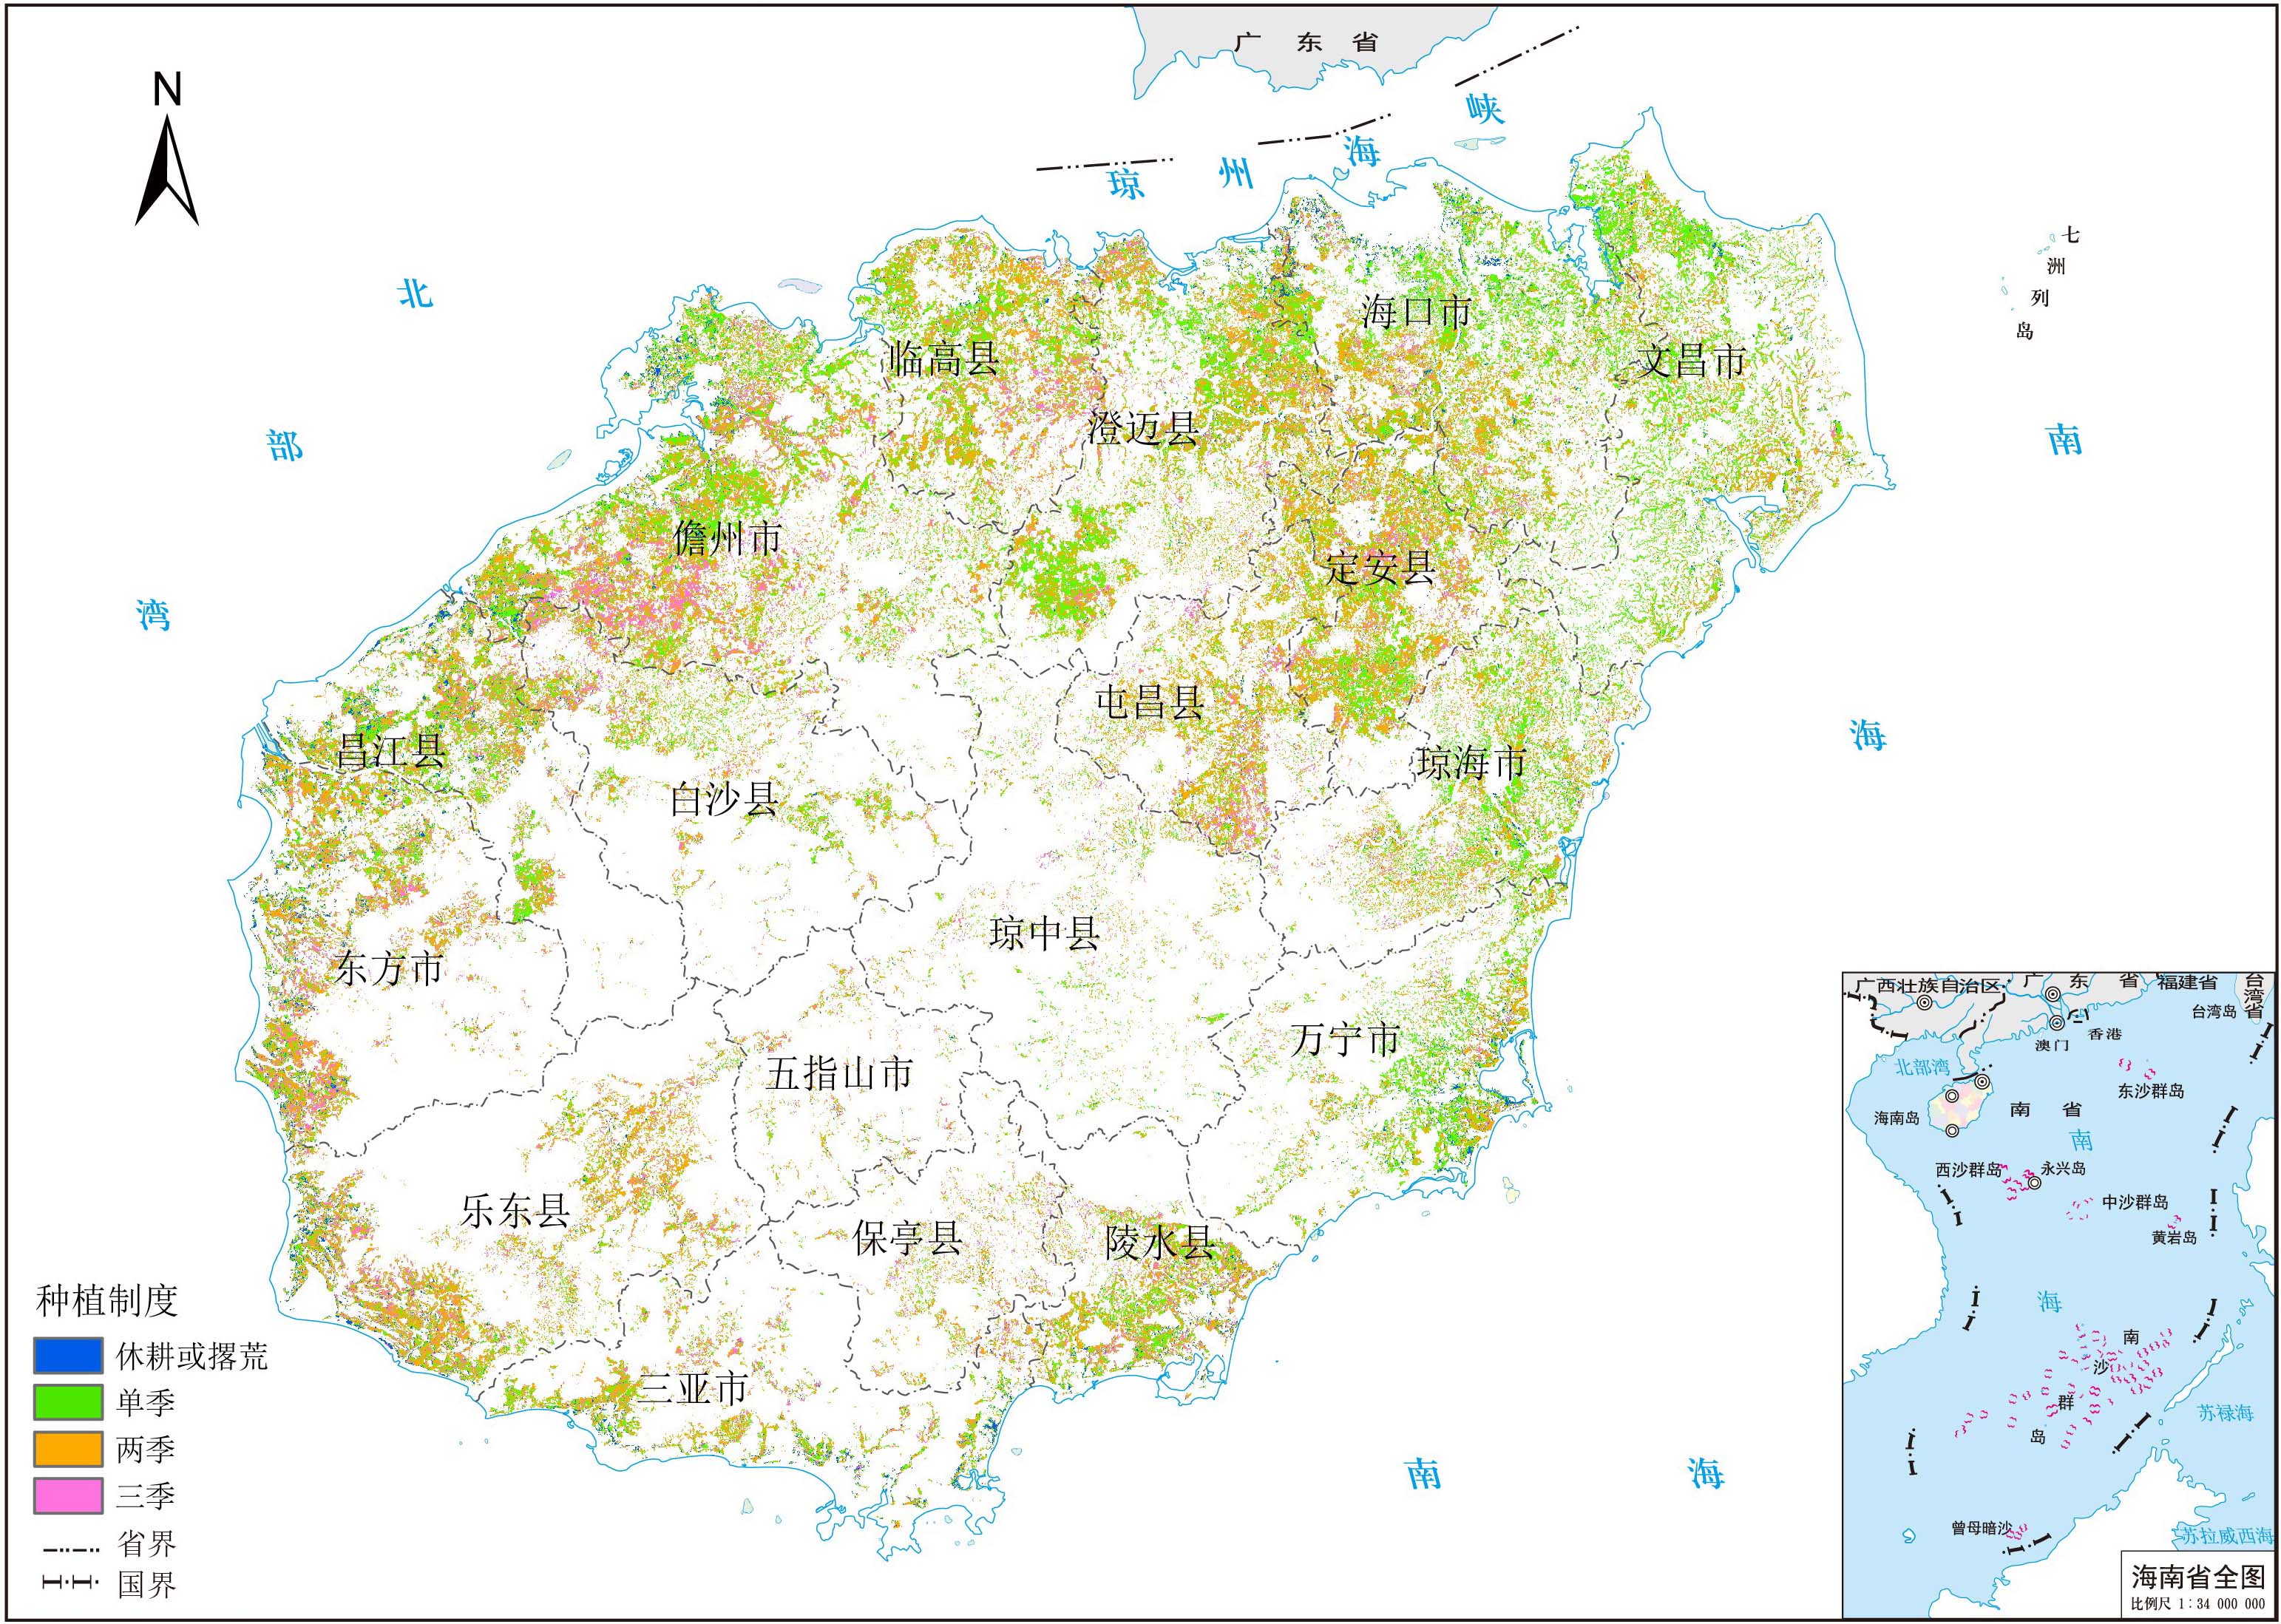
A dataset of multiple cropping index with 10 m spatial resolution in Hainan Island from 2016 to 2020
Dataset Overview
The multiple cropping index is an important parameter for the evaluation of cultivated land fertility and agroecological evaluation. The development of remote sensing technology makes it possible to monitor the multiple cropping index with high temporal and spatial resolution. Based on Sentinel-2 data, the Savitzky-Golay filtering method and the quadratic difference method were used to carry out a research on the extraction method of the multiple cropping index in Hainan Island, which was verified with the ground sample data in 2020. On this basis, the data set of multiple cropping index in 2016 and 2020 were extracted. According to the verification of ground survey data in 2020, the overall accuracy of land multiple cropping index in 2020 was 91.9%, and the Kappa coefficient was 0.9. This data set can be used as the basic data for the analysis of temporal and spatial changes of cultivated land resources in Hainan, and can also provide data and decision support for Hainan to implement the sustainable development strategy of tropical efficient agriculture.

Dataset Details
Spatial Resolution: 10m
Time Resolution: 2 years
Product Number: XDA19030105_001
Create Institution: International Research Center of Big Data for Sustainable Development Goals
Created By: Ye Huichun
Creation Date: 2022-12-13T08:50:13.153Z
File Size: 3
Data Format: GeoTiff
Type Of Data: Raster
Data Label:
Data Citation
Ye Huichun. A dataset of multiple cropping index with 10 m spatial resolution in Hainan Island from 2016 to 2020. 2022
Data Licence Agreement
Users of this product shall clearly indicate the source as " A dataset of monitoring the 10 m spatial resolution multiple cropping index in Hainan Island from 2016 to 2020" in all forms of research output, including, but not limited to, published and unpublished papers, theses, manuscripts, books, reports, data products, and other academic output. The data producers are not responsible for any losses caused by the use of the data. The boundaries and marks used in the maps do not represent any official endorsement by or opinion of the data producers.
Funded Projects
Supported by Hainan Provincial Department of Science and Technology under Grant No. ZDKJ2019006 and the "Strategic Priority Research Program" of the Chinese Academy of Science, Grant No. XDA19030105
