Contact Information

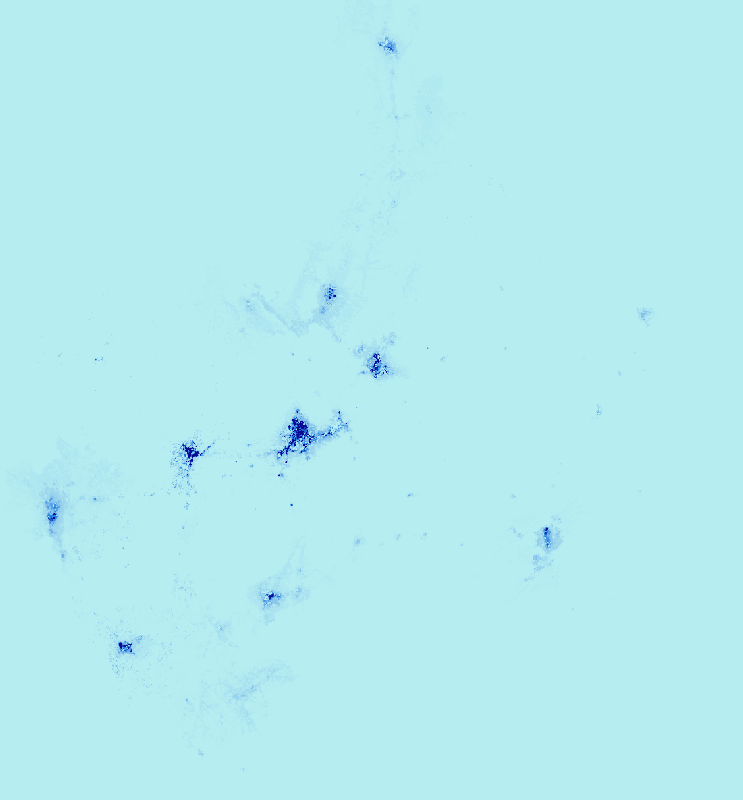
25-meter, 12-hour population spatial data products for Chenzhou and Guilin in 2020
Dataset Overview
The 25 m/12 h high spatiotemporal resolution population dynamics distribution is produced based on the Transformer-CNN cross-scale model using multi-source remote sensing, POI, AOI, urban functional areas, and Baidu thermal data. (1) Data processing Nighttime lights, DEM, and NDVI were resampled to 100 m and 10 m using the nearest neighbor; farmland, forest, and impervious surface were extracted from land cover and the grid percentage was calculated; POIs were cleaned and classified and then a density tensor was generated using a 500 m bandwidth kernel density; 100 m labels were obtained by census correction of WorldPop; all data were unified with GCS_WGS_1984 coordinates and Web Mercator projection, and Guilin and Chenzhou were clipped according to administrative boundaries. (2) Preliminary grid map prediction Multi-source population mapping was established using 100 m census correction labels and migrated to 10 m; POIs were introduced to supplement remote sensing details; Transformer+CNN captured global-local relationships, and feature attention was used to fuse remote sensing and POIs to output 10 m nighttime population of the two cities. (3) Diurnal population map distribution Based on the 10 m nighttime population, a temporal downscaling framework was constructed by coupling Baidu thermal and functional areas to generate diurnal dynamic population, which was then verified using census and thermal data.

Dataset Details
Spatial Resolution:
Time Resolution:
Product Number: CBAS2025RJ047
Create Institution: Big Earth Data Center, CAS
Created By: Feng Peijun, Zheng Ma, Jining Yan, et al.
Creation Date: 2025-10-19 19:40:02
File Size: 1
Data Format: TIFF
Type Of Data: 栅格
Data Label:
